TeX related snippets
Getting Yannis Haralambous' Blackletter Fonts to work
I am using the OpenSuse packaged TeX system, so with other systems, you may not run into the same trouble as me. The situation: You can install with YaST several texlive-yfonts-* packages. This is fine, but unfortunately, the tfm files that TeX needs are not included. So you have to download the packages yfrak, ygoth and yswab from CTAN. Extract the tfm files you find in there and put them into the appropriate subdirectory of your local texmf tree (for me, this is /usr/local/share/texmf) and therein fonts/tfm/public/yfonts.
The initials need special treatment, as there is no Type-1-Version. You have to download both yinit and yinit-as and copy the *.mf files to fonts/tfm/public/yinitas. You may think about using the otf version instead, if you will use a TeX engine that supports it (luaTeX or XeTeX).
When you're done, run sudo mktexlsr and sudo updmap-sys to add the map file yfrak.map. You may consult my linux page about picking the right parameters for updmap-sys.
Charts, again
Just some weeks later, I had to maintain the next survey. This time, there had to be no publication, but I had to do some charts anyway. I also had to do them several times during the progress of the survey. To avoid writing a one-shot program, I decided to stick to R. Some googling found the tikzdevice module, and this enabled me to use R to produce graphics that I could easily and seamlessly include into a LaTeX report.
Here is an excerpt of the R script:
rohdaten <-read.csv("export.csv", sep=";", quote="\"")
# delete some columns
rohdaten$Anregung = NULL
# treat numerical column as non-numerical (in fact boolean)
rohdaten$X10_BildeBM_KG_aus <- as.factor(rohdaten$X10_BildeBM_KG_aus)
# generate subsets dependend on the answer to one question
kbler <- subset(rohdaten, X10_BildeBM_KG_aus == "1")
# enable tikz output
require( tikzDevice )
# generate tables for each question
SummeX10_BildeBM_KG_aus <- table(rohdaten$X10_BildeBM_KG_aus)
# generate a bar chart
tikz('bild8a.tex',width=2.2,height=2.5,
	packages=c(getOption('tikzLatexPackages'),
	"\\usepackage[sfdefault,light]{roboto}")
)
barplot(SummeX10_BildeBM_KG_aus, names.arg=c("nein", "ja"))
dev.off()
# that's all
quit()
As it is easy to write scripts in R, the process could be automated almost completely. Download survey data, run the R script, run LaTeX, deliver. Fine. Preparing the script and the LaTeX document was somewhat dull, but this is probably my fault, as I did not dive deep into programming loop construction with R.
The LaTeX code has to load the TikZ package, the graphics were just read in. Here is a simplified excerpt:
\documentclass[a4paper,10pt]{article}
\usepackage{tikz}
\begin{document}
\input bild8a.tex
\end{document}
I had to generate bar charts with different numbers of participants, unfortunately I did not find out how to avoid adjusting the height of the charts, so you can compare the proportions of answers but not absolute values. Seems like I have to learn more R.
It was easy to have R use the proper font for the charts, but I would have liked to influence the labeling of bar charts to a greater amount. R does a good job in omitting labels when there is not enough space left, but I would have preferred a smaller font. Also I would have liked to reduce the bounding box of the graphics but did not find a way besides manipulating the generated TikZ code – and I am not so crazy to do such things.
Doing Charts
I had to do about a hundred charts displaying results from a survey. There was a short deadline, but intermediate results were available in advance. Preparing the data and generating the final charts had to be done within a few hours.
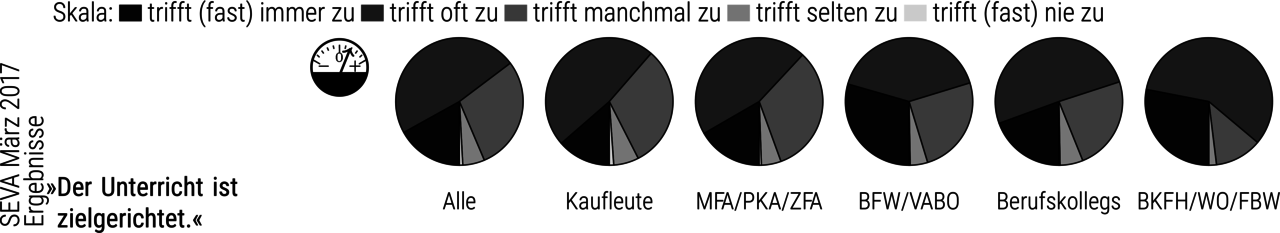
For reasons I do not want to discuss here I chose pie charts for the bulk of the items and bar charts for a few. One item and charts to document answers of six distinct groups of people had to fill a space of about 19 times 4 centimeters. There was a limited choice of fonts, the printing had to be done in gray scale and the best possible print quality was desired.
There are lots of possibilities to fulfill such a task. I will mention a few:
- Using spreadsheet software was not appropriate: Not enough control about the visual appearance, probably many tears when dealing with a sheet with a hundred charts, no chance to get high print quality.
- Using graphics software was ruled out, too: Doing a hundred charts by hand can hardly be done within a few hours.
- R would probably be first choice if I had to do such jobs in a regularly manner, at best in conjunction with extensions like ggplot2. But alas, my knowledge of R is on less than beginner’s level.
Having ruled out all standard solutions, only programming was left over. My choice of languages and tools is mainly guided by my experience with previous projects, so I ended up doing data preparation with Perl and printing with TeX.
Processing CSV data with Perl is easy; for summing up the survey data I chose hashes. I am not sure if this was the best idea, probably a database would have been better. The code using hashes was very fast and did not require much typing, but it is code for just this special project, adopting it to other task would be painful. Occasionally I used R during the project to check if my Perl program was working right.
Perl offers interfaces to several graphics libraries. I knew GD, which is inappropriate due to its confinement to pixel graphics. I did not want to produce low level PostScript. as I would have to do kerning and line breaking by hand. For the same reason, using one of the PDF libraries was ruled out. As I know TeX, it was quite natural to stick to it. Line breaking and font related tasks are easy, with PGF/TikZ there is a graphics library that is sufficient to draw some charts. Of course, writing a program that generates a program in another language makes your eyes go crisscross, as is written in the Camel book.
Here is a short excerpt to give you an impression:
if($haelfte == 0){
$anfang = 0;
$ende = 6;
print OUT <<_beraterstart;
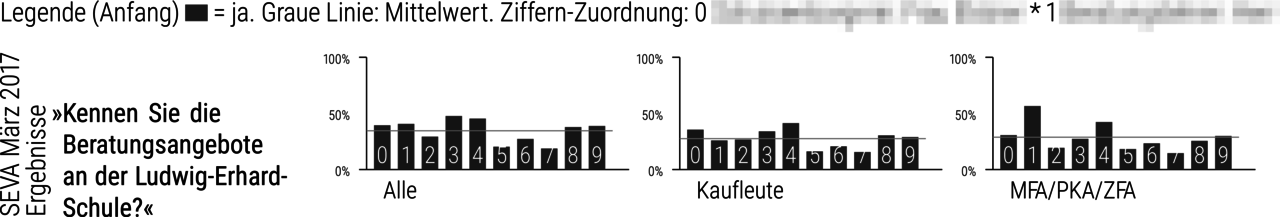
Legende (Anfang)
\\tikz{\\fill[black!70] (0,0) rectangle (.3,.22);} = ja. Graue Linie: Mittelwert.
%\\tikz{\\draw (0,0) rectangle (.3,.22);} nein.
Ziffern-Zuordnung:
_beraterstart
} # and so on
PGF and TikZ offer lots of features beyond drawing; there are loops and variables and calculations, so it would have been possible to do most of the data processing directly with TeX. But as Perl had to be involved anyway, I chose to generate dumb TeX code and do all the calculations with Perl. This made debugging comparatively easy and increased processing speed.
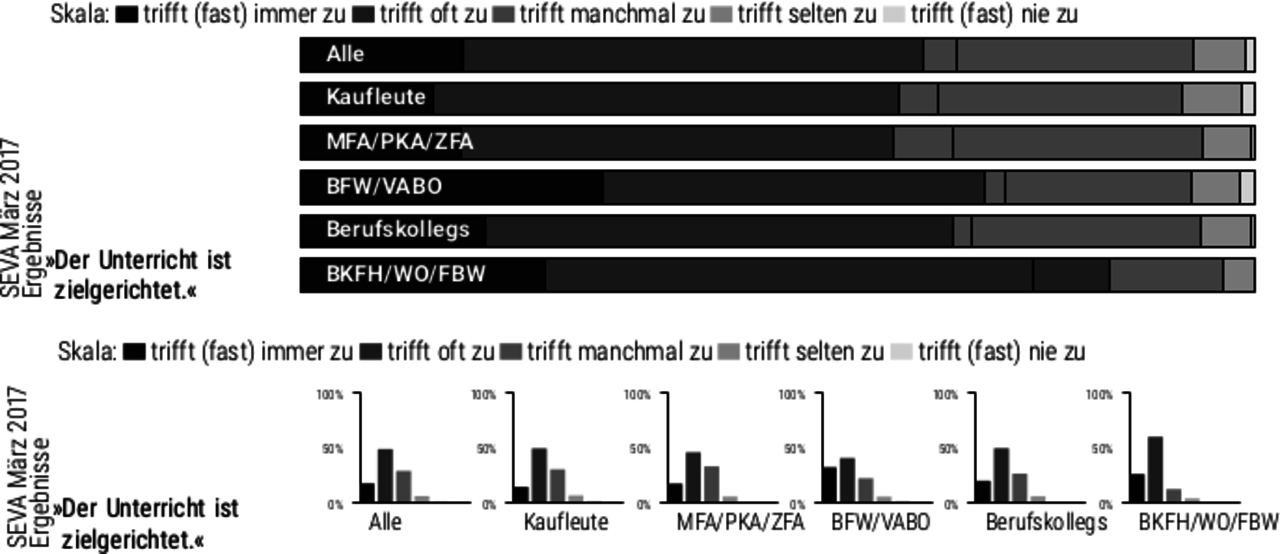
Bar Charts Done With Native TikZ
Just In Case: Here are some bar charts. The sideways rotated stacked bars are probably better than the pie charts, but I did not like the heavy horizontal striping in conjunction with the rest of the page where the charts would appear. The vertical bar charts are in my opinion in this case not good for anything.
Correcting a TeX Type 1 Font Mess
This article deals with complications with the use of unofficial fonts with TeX on OpenSuSE leap.
My System
I am and have been using OpenSuSE (and its predecessor SuSE Linux) for several years. As it was never necessary to setup a fresh system even when mainboards and harddisks got changed (hello windows users, is there any envy on your side?), my system grew and aged. My TeX system now consists of three TDS trees:
- /usr/share/texmf: The official TDS tree by SuSE
- /usr/local/share/texmf: TDS tree width my own stuff, e.g. my private letter head, styles, fonts, and packages I use that don't come with OpenSuSE, like the Lucida fonts.
- /var/lib/texmf: TDS tree for volatile things, e.g. TeX formats.
The transition to use these trees in this way took some time, years ago. If you do not bother to keep your TeX files separated like this: You really should.
Font trouble
Trouble started when I installed the Roboto fonts. It took me some time to have pdfTeX find them. When it finally did, Lucida support was broken, albeit in a strange way: mktexpk automatically generated pk fonts (bitmaps) in type 3 format and included them into the final PDF file. I did not want this. There are pixels visible at higher resolutions, file size bloats. Now to the resolution:
Having changed your TDS trees, you always should run mktexlsr or texconfig rehash in superuser mode to make your TeX system find the changed files. Having installed fonts, you have to use updmap. And this is where the trouble came from.
When you call updmap, updmap will list its config files. The order is quite important. Unless you do something special, updmap will always change the first listed config file. My list looks like this:
/etc/texmf/web2c/updmap.cfg
 /usr/local/share/texmf/web2c/updmap.cfg
 /usr/share/texmf/web2c/updmap.cfg
The first and third are identical, as OpenSuSE sets a link. updmap understands that the first file is system-wide, so it warns about hidden sys mode. If you see this warning, you may—like me—probably be tempted to run updmap-sys in superuser mode. Unfortunately, this will not help, as updmap-sys will not incorporate things from private TDS trees. The solution is to supply your own updmap.cfg in the command line to updmap and to run it in superuser mode, like this:
sudo updmap --cnffile /usr/local/share/texmf/web2c/updmap.cfg --force --enable Map lucida.map
By the way, Kpathsea offers valuable tools for debugging. kpsewhich shows which file will be used, while kpsewhere shows all files with the name you are looking for. Calling pdfTeX with kpathsea debugging (pdflatex --kpathsea-debug -1 >logname 2>&1 filename) shows all the efforts of kpathsea.
It looks so easy, in retrospect, but in fact there had been moments where I was in despair. But even then, I did not consider to edit the font maps by hand.